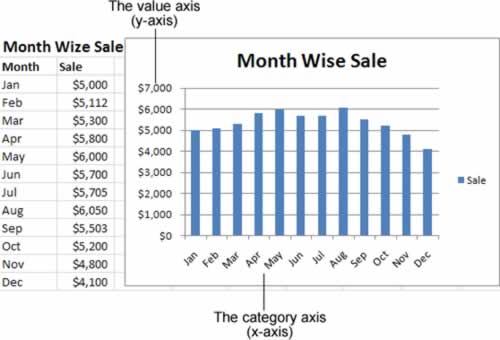
To create the chart shown in figure above, Excel performs a few straightforward steps. First, it extracts the text for the chart title from cell A1. Next, it examines the range of data (from $4,100 to $6,050) and uses it to set the valueor Y-axisscale. You'll notice that the scale starts at $0, and stretches up to $7,000 in order to give your data a little room to breathe. (You could configure these numbers manually, but Excel automatically makes common-sense guesses like these by looking at the data you're asking it to chart.) After setting the vertical scale, Excel adds the labels along the bottom axis (also known as the X-axis or category axis), and draws the columns of appropriate height.
A key point to keep in mind is that charts are dynamic. In other words, a chart series is linked to the data in your worksheet. If the data changes, the chart is updated automatically to reflect those changes.
Embedded and Standalone Charts
The chart showed in figure below is an embedded chart. As with other drawing objects (such as Shapes or SmartArt), you can move an embedded chart, resize it, change its proportions, adjust its borders, and perform other operations. Using embedded charts enables you to print the chart next to the data that it uses. Embedded charts appear in a worksheet, in a floating box alongside your data. You can move the chart by dragging the box around your worksheet, although depending on where you put it, you may obscure some of your data.
Your other option is to create a standalone chart, which looks the same but occupies an entire worksheet. That means that your chart data and your chart are placed on separate worksheets. When you create standalone chart (chart on separate worksheet), the chart occupies the entire sheet. If you plan to print a chart on a page by itself, standalone chart is often your better choice. If you have many charts to create, you may want to create each one on a separate worksheet (standalone) to avoid cluttering your worksheet. This technique also makes locating a particular chart easier because you can change the names of the worksheet's tabs to provide a description of the chart that it contains.
Usually, you'll use an embedded chart if you want to create printouts that combine both your worksheet data and one or more charts. On the other hand, if you want to print the charts separately, it's more convenient to use standalone charts. That way, you can print an entire workbook at once and have the charts and the data on separate pages.