This tutorial relies on Excel's ability to perform web queries, so you'll need Excel 97 or higher. Excel's Web Queries tool transforms simple HTML tables into Excel spreadsheets.
This code uses several features of both Company Web Services and Excel. Once you see how it's put together, building your own queries is a snap.
This tutorial starts with a standard XML/HTTP query. We want to analyze sales ranks of XYZ , so we build a standard query to retrieve those results.
http://xml.company.com/onca/xml3?t=insert associate tag[RETURN] &dev-t=insert developer token&PowerSearch=publisher:XYZ [RETURN] %20and%20keywords:Tutorial&type=heavy&mode=books&f=xml
This request uses an Company Power Search to specify a publisher (XYZ) and a keyword (Tutorial).
The next task is to get the Company response data into a form that Excel can work with. Because Excel Web Queries rely on simple HTML, Company's response must be transformed. As was done in the last two Tutorials, XSL stylesheets are a quick way to make that happen.
Put the following code into a file called excel_SalesRank.xsl. This file will narrow the Company response to the fields needed and turn it into HTML.
<?xml version="1.0" ?>
<xsl:stylesheet version="1.0" xmlns:xsl="http://www.w3.org/1999/XSL/
Transform">
<xsl:output method="html"/>
<xsl:template match="/">
<html xmlns:o="urn:schemas-microsoft-com:office:office"
xmlns:x="urn:schemas-microsoft-com:office:excel"
xmlns="http://www.w3.org/TR/REC-html40">
<body>
<table id="basic">
<tr>
    <th bgcolor="#cccccc" colspan="3">Sales Data</th>
</tr>
<tr>
    <th bgcolor="#999999">ASIN</th>
    <th bgcolor="#999999">Title</th>
    <th bgcolor="#999999">Sales Rank</th>
</tr>
<xsl:for-each select="ProductInfo/Details">
<tr>
    <td><xsl:value-of select="Asin" /></td>
    <td><xsl:value-of select="ProductName" /></td>
    <td><xsl:value-of select="SalesRank" /></td>
</tr>
</xsl:for-each>
<tr><td colspan="3"></td></tr>
<tr>
    <td bgcolor="#ffcc00" colspan="2" align="right">
        <b>Average Sales Rank</b>
    </td>
    <td bgcolor="#ffcc00">=ROUND(AVERAGE(C3:C<xsl:value-of
select="count(ProductInfo/Details) + 2" />),0)</td>
    </tr>
</table>
</body>
</html>
</xsl:template>
</xsl:stylesheet>
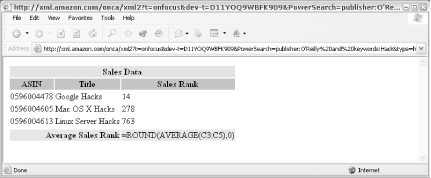
This file takes an AWS response and turns it into a simple HTML table. The xsl:for-each section loops through the Details node and adds a table row for each result. Once you upload this file to a publicly accessible server, you should be able to view the results of the transformation in a web browser by specifying the XSL file's URL in the request. Just modify the URL from the last step by replacing f=xml with f=http://example.com/excel_SalesRank.xsl.
http://xml.company.com/onca/xml3?t=insert associate tag [RETURN]
&dev-t=insert developer token &PowerSearch=publisher:XYZ[RETURN]
%20and%20keywords:Tutorial&type=heavy&mode=books[RETURN]
&f=http://example.com/excel_SalesRank.xsl
You should see a table like the one shown in figure with the data from the previous request. Note that the last cell of the table contains an Excel function. It looks like gibberish at this point, but serves an important purpose once it's inside Excel.
Figure. HTML table of sales data
To glue the two applications together, use an Excel Query (IQY) file. The file will hold all of the information about the query, including the URL that points to the data. Create a new file called amzn_avg_sales.iqy and add this code:
WEB
1
http://xml.company.com/onca/xml3?t=insert associate tag[RETURN]
&dev-t=insert developer token&PowerSearch=publisher:XYZ[RETURN]
%20and%20keywords:Tutorial&type=heavy&mode=books&f=http://example.com[RETURN]
/excel_SalesRank.xsl
The top line lets Excel know that this is a Web Query. The 1 is a Web Query version number (this will always be set to 1) followed by the URL of the AWS query that includes the XSL file. Save the file and note its location.
Now double-click the amzn_avg_sales.iqy file. Excel should open, contact the URL, and populate a spreadsheet resembling see figure.
Figure. Excel spreadsheet with Company sales rank data
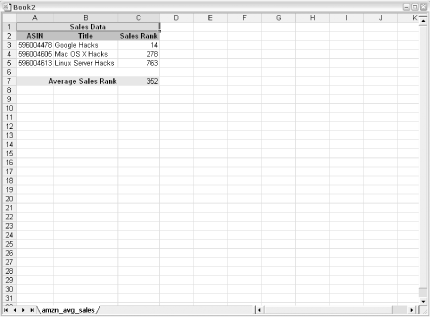
You now have some useful data-the average sales rank of the books in an application well-suited to manipulation and data analysis. You can update the data at any time by right-clicking any of the data cells in the spreadsheet and choosing Refresh Data.
Hacking
The tough part of this tutorial is knowing how to get data directly from AWS into Excel. Once inside Excel the data is available to all of the features Excel offers: calculations, graphing, user input, etc. Here are a few quick ways to extend this example further.
Making the Query Dynamic
Instead of limiting the data to static information built into the query inside the IQY file, you can add a bit of interactivity. Suppose we have a list of ASINs and want to know the average sales rank, but we don't have the list when we're building the IQY file. Excel offers the ability to prompt the user for information before making the Web Query.
The only change you need to make is to place the prompt information inside the Web Query URL where you'd like the user input to go. Change the URL inside amzn_avg_sales.iqy to:
http://xml.company.com/onca/xml3?t=insert
associate tag &dev-t=insert  [RETURN]
developer token &PowerSearch=isbn:["ASINs","Enter a list of ASINs  [RETURN]
separated by pipe symbols (|)."] &type=heavy&mode=books&f=http://[RETURN]
example.com/excel_SalesRank.xsl
Now, you're prompted for a list of ASINs upon opening the file, as you can see in Figure.
Figure. ASINs Excel dialogue
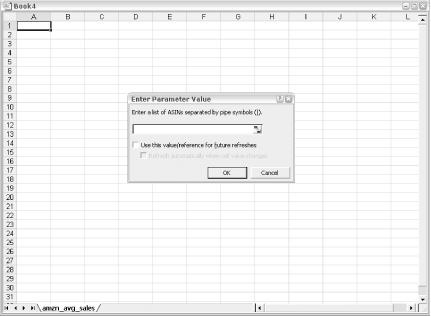
Try these if you don't have a list in mind:
1565927141|0596003595|0596002246|0596002505
This should give you the average sales rank for the ASINs you enter. It could be different every time!
Using Different Data
As in the previous example, changing the data you're working with is just a matter of changing the URL of the AWS query. But if you want to work with a different set of data (like the cost of each item rather than sales rank), you need to tweak the XSL stylesheet a bit.
To see how the stylesheet makes all the difference, create a new file called excel_PriceDiff.xsl and add the following code:
<?xml version="1.0" ?>
<xsl:stylesheet version="1.0" xmlns:xsl="http://www.w3.org/1999/XSL/
Transform">
<xsl:output method="html"/>
<xsl:template match="/">
<html xmlns:o="urn:schemas-microsoft-com:office:office"
xmlns:x="urn:schemas-microsoft-com:office:excel"
xmlns="http://www.w3.org/TR/REC-html40">
<body>
<table id="basic">
<tr>
    <th bgcolor="#cccccc" colspan="4">Sales Data</th>
</tr>
<tr>
    <th bgcolor="#999999">ASIN</th>
    <th bgcolor="#999999">Title</th>
    <th bgcolor="#999999">List Price</th>
    <th bgcolor="#999999">Company Price</th>
</tr>
<xsl:for-each select="ProductInfo/Details">
<tr>
<td>
  <xsl:value-of select="Asin" />
</td>
<td>
  <xsl:value-of select="ProductName" />
</td>
<td>
  <xsl:value-of select="ListPrice" />
</td>
<td>
  <xsl:value-of select="OurPrice" />
</td>
</tr>
</xsl:for-each>
<tr><td colspan="3"></td></tr>
<tr>
    <td bgcolor="#ffcc00" colspan="3" align="right">
        <b>Average List Price</b>
    </td>
    <td bgcolor="#ffcc00">=ROUND(AVERAGE(C3:C<xsl:value-of
select="count(ProductInfo/Details) + 2" />),2)
    </td>
</tr>
<tr>
    <td bgcolor="#ffcc00" colspan="3" align="right">
        <b>Average Company Price</b>
    </td>
    <td bgcolor="#ffcc00">=ROUND(AVERAGE(D3:D<xsl:value-of
select="count(ProductInfo/Details) + 2" />),2)
    </td>
</tr>
</table>
</body>
</html>
</xsl:template>
</xsl:stylesheet>
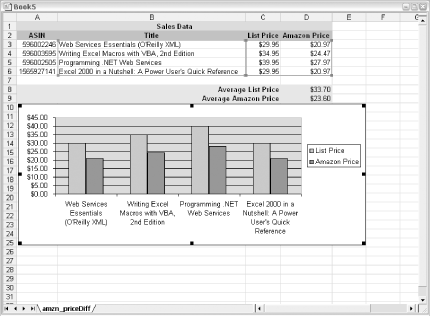
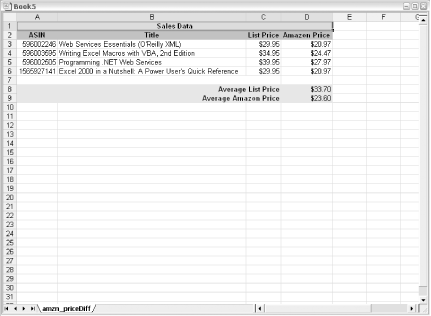
Upload this XSL file to a public server and note the URL. Create a new query file called amzn_price_diff.iqy and use the same code as in previous examples, but change the f= variable to the URL of the new stylesheet. Open the file and you should see a new spreadsheet with the list price and the Company price, as shown in the figure.
Figure. Excel spreadsheet with price data
Graphing Results
Once the data is in Excel, it's easy to create graphs to get a sense of what the data means at a glance. Here's how to add a graph to the spreadsheet:
-
Building on the last example, run the amzn_price_diff.iqy file. You should see data that includes a list of books along with the list price and Company price.
- Highlight all of the Title, List Price, and Company Price cells.
- Choose Insert » Chart from the menu. This will start the chart wizard.
- Click "Finish."
You should now have a nice graphic representation of the data.
Figure. Graph of price data