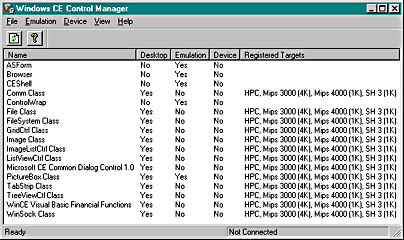
Figure 5-15 Windows CE Control Manager
You need to download only the controls you are using in your project, but they must be downloaded to either the emulator or to the HPC depending on the target you have selected. Select the controls to download and use the Emulation or Device menus to install or uninstall the controls. Once you have completed these steps you can run your program in the normal way-using F5 or the Run command.
Running a Windows CE application in the development environment is a little slower than normal, because the program is downloaded and run within the selected environment. The debugger application interfaces with that environment. The debug facility offers a reduced set of functionality compared to other versions of Visual Basic. Once in the debugger you can set breakpoints, but you cannot change any code. The debugger supports the same debug actions as in other versions. Figure 5-16 shows the debug window.
The biggest difference between this debug window and that which you will become accustomed to is that you cannot change code within it. To change your code you will need to stop the application, close the debugger, amend your code, and then rerun it. Unfortunately, if you keep the debug window open after stopping the application, you need to set your breakpoints again when you restart another instance of the debugger-there's no way around it!
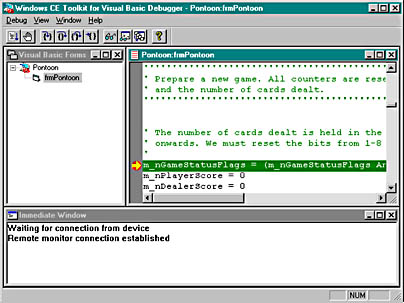
Figure 5-16 The debug window
Run-time errors in the development environment are dealt with differently than what you might be used to. Misspelled variable or function names and parameter constants are not all detected until the procedure is entered. One tip for avoiding these errors is to always type these elements in lowercase. If valid, the capitalization will be changed to that of the declaration; if not, the case will remain unchanged. This will give you a good indication that a variable name is correct.
Sometimes you might find the debug window a distraction. If this happens, you can prevent the debug window from being displayed by deselecting the Build Debug option on the Make tab of the Project Properties dialog box.