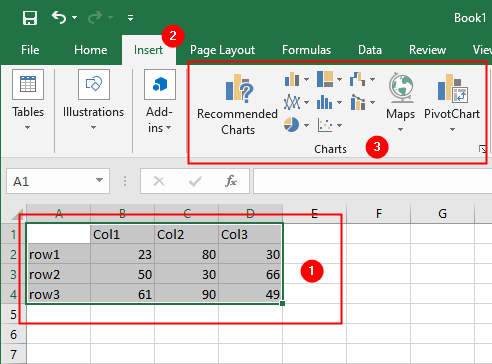
To create an embedded chart, select data range, click Insert tab, and select a chart type from the Charts group, as shown in Figure:
Insert a Chart Sheet
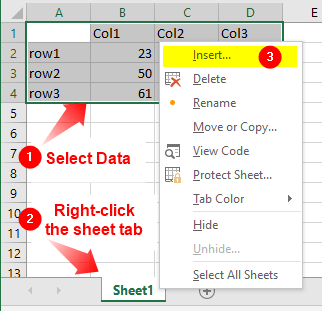
To create a chart on a separate sheet, select cells range, right-click a sheet tab in the workbook and choose Insert, as shown in Figure:
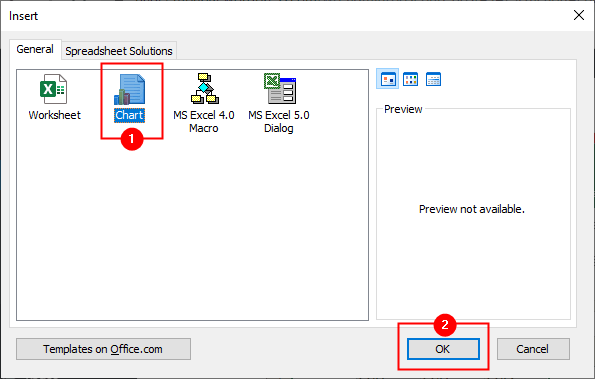
In the Insert dialog box, select Chart and click OK.
A chart will be created on a separate sheet, Chart1 , as shows in Figure:
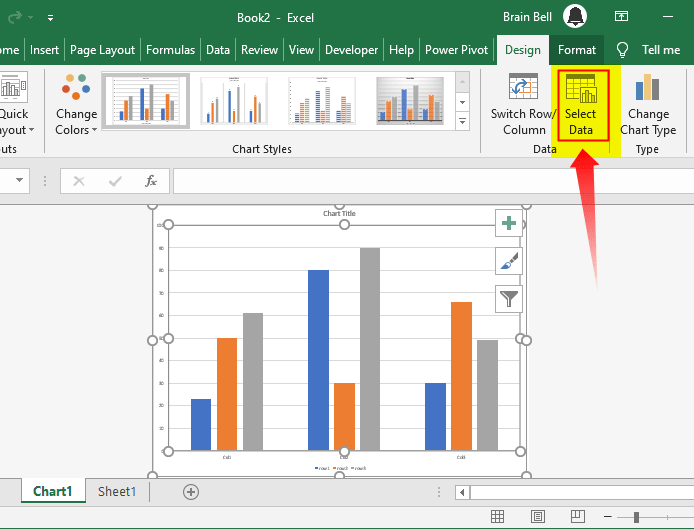
If you see a blank chart or you need to change the data source of the chart, select the chart then click Select Data button from the Design tab, as shown in the above Figure. Excel will display the Select Data Source dialog box:
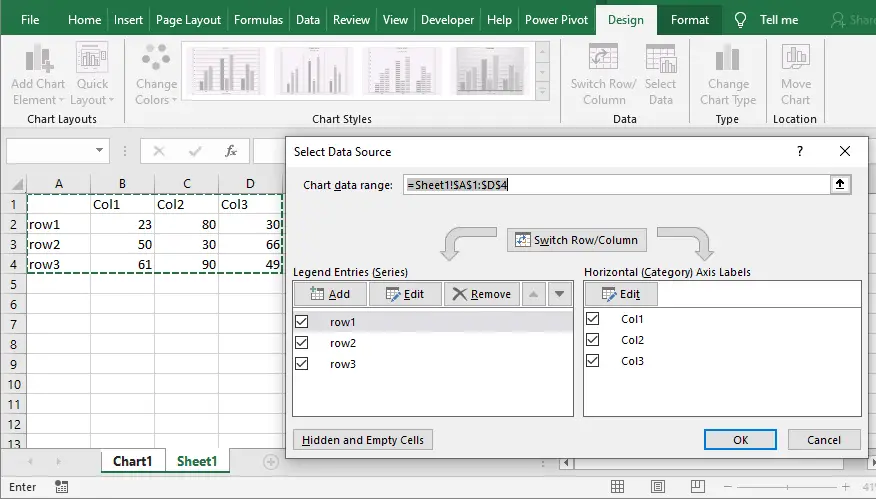
Click the sheet tab, such as Sheet1, and select the cells range. Excel will fill in the chart data range box in the dialog box as shown in the Figure. Click OK to return to the chart.
Move Embedded Chart
You can create a chart on a separate sheet by moving an existing embedded chart. To move a chart, select the chart and click Design tab > Move Chart as shown in the Figure:
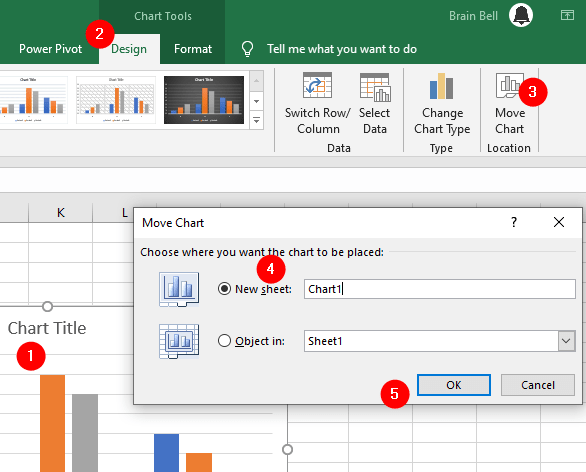
The Move Chart dialog box appears, select New sheet, give it a name and click Ok to move the chart on the new sheet.