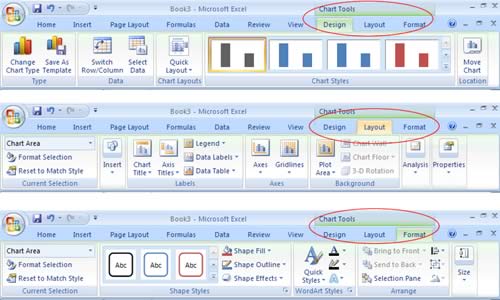
Design
This tab lets you change the chart type and the linked data that the chart uses. It also lets you choose a chart style and layout, two ways to improve the appearance of a chart.
Layout
This tab lets you configure individual parts of the chart. You can add shapes, pictures, and text labels, and you can configure the chart's gridlines, axes, and background.
Format
This tab lets you format individual chart elements, so you can transform ordinary items into eye candy. You can adjust the font, fill, and borders uses for chart titles and shapes, among other things.
Browsing Excel Chart Gallery
Sometimes the ribbon approach is a bit awkward when you're trying to find a less commonly used chart type. In this situation, you may prefer to look at the full list of chart types and subtypes. To do so, head to the ribbon's Insert Charts section, and then click the dialog launcher (the square-with-an-arrow icon in the bottom-right corner). You see the Insert Chart dialog box (see figure below).
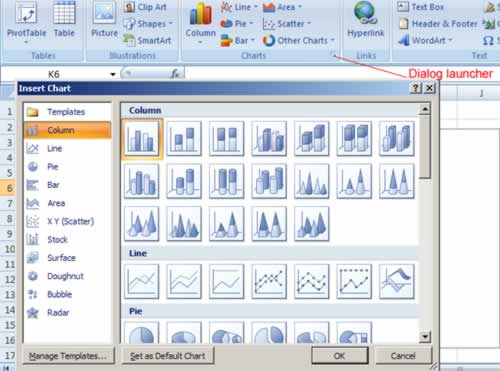
The Insert Chart dialog box doesn't just let you create charts. You can also designate the default chart type (the one that's used if you select some cells, and then press F11 to create a chart in a single bound). To designate a default chart, select it, and then click "Set as Default Chart". Lastly, the Insert Chart dialog box lets you use a custom chart template.