Listing 1. Code That Produces the Product Line Report in Figure 10
Sub ProductLineReport()
    ' Line of Business and Market as Row
    ' Years as Column
    Dim WSD As Worksheet
    Dim PTCache As PivotCache
    Dim PT As PivotTable
    Dim PRange As Range
    Dim FinalRow As Long
    Dim GrandRow As Long
    Dim FinalReportRow as Long
    Dim i as Integer
    Dim TotColumns()

    Set WSD = Worksheets("PivotTable")
    Dim WSR As Worksheet
    Dim WBO As Workbook
    Dim WBN As Workbook
    Set WBO = ActiveWorkbook

    ' Delete any prior pivot tables
    For Each PT In WSD.PivotTables
        PT.TableRange2.Clear
    Next PT

    ' Define input area and set up a Pivot Cache
    FinalRow = WSD.Cells(Application.Rows.Count, 1).End(xlUp).Row
    FinalCol = WSD.Cells(1, Application.Columns.Count). _
        End(xlToLeft).Column
    Set PRange = WSD.Cells(1, 1).Resize(FinalRow, FinalCol)
    Set PTCache = ActiveWorkbook.PivotCaches.Add(SourceType:= _
        xlDatabase, SourceData:=PRange.Address)

    ' Create the Pivot Table from the Pivot Cache
    Set PT = PTCache.CreatePivotTable(TableDestination:=WSD. _
        Cells(2, FinalCol + 2), TableName:="PivotTable1")

    ' Turn off updating while building the table
    PT.ManualUpdate = True

    ' Set up the row fields
    PT.AddFields RowFields:=Array("Line of Business", _
        "In Balance Date"), ColumnFields:="Market"

    ' Set up the data fields
    With PT.PivotFields("Revenue")
        .Orientation = xlDataField
        .Function = xlSum
        .Position = 1
    End With

    ' Calc the pivot table
    PT.ManualUpdate = False
    PT.ManualUpdate = True

    ' Group by Year
    Cells(3, FinalCol + 3).Group Start:=True, End:=True, _
        Periods:=Array(False, False, False, False, False, False, True)

    ' Move In Balance Date to columns
    PT.PivotFields("In Balance Date").Orientation = xlColumnField
    PT.PivotFields("Market").Orientation = xlRowField

    PT.PivotFields("Sum of Revenue").NumberFormat = "#,##0,K"
    PT.PivotFields("Line of Business").Subtotals(1) = True
    PT.PivotFields("Line of Business").Subtotals(1) = False
    PT.ColumnGrand = False

    ' Calc the pivot table
    PT.ManualUpdate = False
    PT.ManualUpdate = True

    ' PT.TableRange2.Select

    ' Create a New Blank Workbook with one Worksheet
    Set WBN = Workbooks.Add(xlWBATWorksheet)
    Set WSR = WBN.Worksheets(1)
    WSR.Name = "Report"
    ' Set up Title for Report
    With WSR.[A1]
        .Value = "Revenue by Market and Year"
        .Font.Size = 14
    End With

    ' Copy the Pivot Table data to row 3 of the Report sheet
    ' Use Offset to eliminate the title row of the pivot table
    PT.TableRange2.Offset(1, 0).Copy
    WSR.[A3].PasteSpecial Paste:=xlPasteValuesAndNumberFormats
    PT.TableRange2.Clear
    Set PTCache = Nothing

    ' Fill in the Outline view in column A
    ' Look for last row in column B since many rows
    ' in column A are blank
    FinalReportRow = WSR.Range("B65536").End(xlUp).Row
    With Range("A3").Resize(FinalReportRow - 2, 1)
        With .SpecialCells(xlCellTypeBlanks)
            .FormulaR1C1 = "=R[-1]C"
        End With
        .Value = .Value
    End With

    ' Do some basic formatting
    ' Autofit columns, bold the headings, right-align
    Selection.Columns.AutoFit
    Range("A3").EntireRow.Font.Bold = True
    Range("A3").EntireRow.HorizontalAlignment = xlRight
    Range("A3:B3").HorizontalAlignment = xlLeft

    ' Repeat rows 1-3 at the top of each page
    WSR.PageSetup.PrintTitleRows = "$1:$3"

    ' Add subtotals
    FinalCol = Cells(3, 255).End(xlToLeft).Column
    ReDim Preserve TotColumns(1 To FinalCol - 2)
    For i = 3 To FinalCol
        TotColumns(i - 2) = i
    Next i
    Selection.Subtotal GroupBy:=1, Function:=xlSum, _
        TotalList:=TotColumns, Replace:=True, _
        PageBreaks:=True, SummaryBelowData:=True

    ' Make sure the columns are wide enough for totals
    GrandRow = Range("A65536").End(xlUp).Row
    Cells(3, 3).Resize(GrandRow - 2, FinalCol - 2).Columns.AutoFit
    Cells(GrandRow, 3).Resize(1, FinalCol - 2).NumberFormat = "#,##0,K"
    ' Add a page break before the Grand Total row, otherwise
    ' the product manager for the final Line will have two totals
    WSR.HPageBreaks.Add Before:=Cells(GrandRow, 1)

End Sub
10. It takes less than two seconds to convert 50,000 rows of transactional data to this useful report if you use the code that produced this example. Without pivot tables, the code would be far more complex.
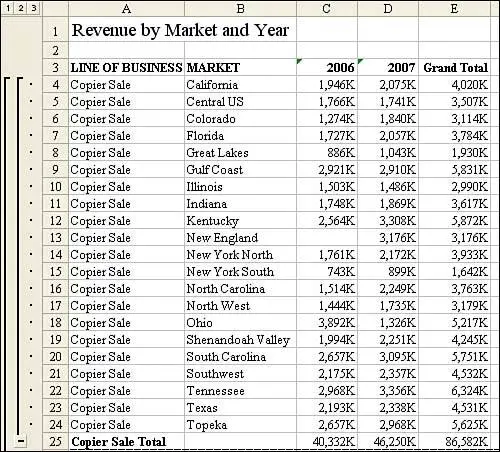
Figure 10 shows the report produced by this code.
by updated